This is a sample output for linear regression:
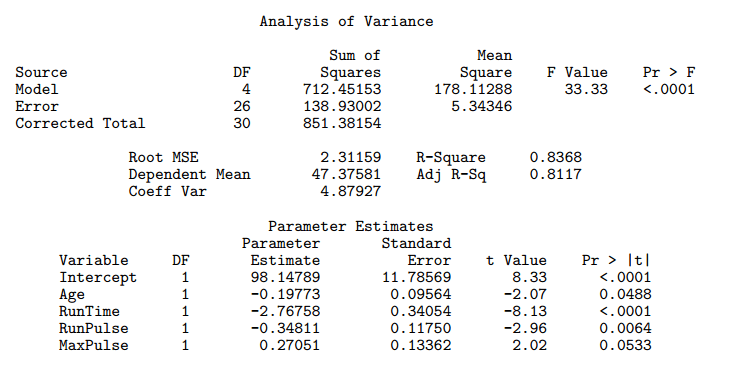
The F Value is computed by dividing the value in the Mean Square column for Model with the value in the Mean Square column for Error. In our example, it’s  .
.
There are two possible interpretations for the F Value in the Analysis of Variance table for the linear regression.
- We are comparing the variances of the model and of the error.
The two factors represent each the numerator of the variance of the model and of the error. What do we want? The only hypothesis of the linear regression model is that is a normal variable with zero mean. Thus we want a small variance for the error, so we can say the errors are close to zero.
 - We are comparing the model with all the variables with the model with only the intercept as variable.
This ambiguity exists because  can either be seen as the numerator of the variance of
  , or as a comparison between the complete model
  and the reduced model in which only the intercept is used.